The Insights tab is the first thing you see when you open a form. It answers three questions in three sub-tabs: what people answered (Answers), where they came from (Visits), and where they gave up (Drop-offs). Pick a date range in the top right and every number on the page follows it.
The four numbers at the top#
Answers and Visits share a strip of four tiles:
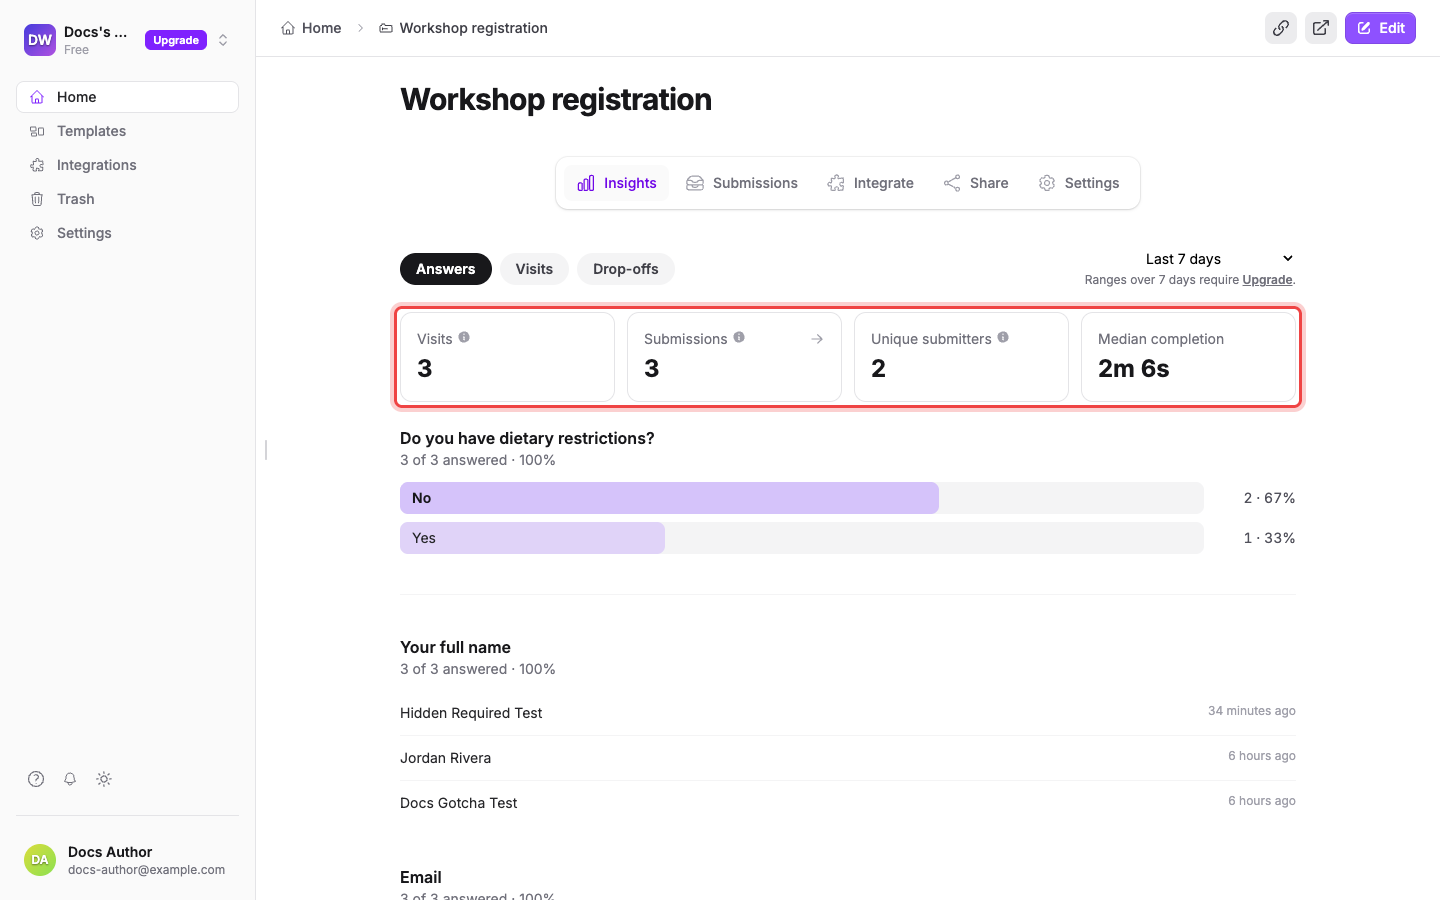
- Visits: how many different people opened your form. Someone who opens it five times counts once.
- Submissions: how many completed responses landed in your inbox. Spam is left out, and so is anything sitting in Incomplete; someone who submits twice counts twice.
- Unique submitters: how many different people are behind those submissions. The gap between this and Submissions is repeat submitters.
- Median completion: how long a typical response took, from opening the form to pressing Submit. On the Visits sub-tab this tile becomes Median visit duration, which counts everyone who looked, not just the people who finished.
Visits divided by Submissions is your conversion rate. If it's low, the Drop-offs sub-tab tells you where you're losing people.
Answers: what people actually said#
The Answers sub-tab walks your form question by question. Each one shows n of n answered with a percentage, then breaks the answers down in the way that suits the question. Choice questions get bars with counts and percentages, number and currency questions get min, avg, median, and max, and open text questions list recent answers with when they came in.
A question sitting well below 100% answered is either optional and being skipped, or confusing. That's a rewrite, not a bug.
Visits: where people came from#
The Visits sub-tab charts Visits over time against Submissions over time, then breaks your traffic down by Sources, Devices, Countries, Cities, Browsers, and OS. Use Sources to tell whether your newsletter or your homepage link is doing the work, and Devices to check that a form you designed on a laptop is actually being filled in on phones.
Visits are anonymous analytics. The Visits report never stores a respondent's IP address and does not follow anyone across devices or other sites. Visits are counted per browser session using the session cookie the form page already sets, so it is not cookie-free, but nothing in the report identifies a person. Submissions themselves are different: each stored response keeps the referrer, IP address and browser of the person who sent it.
Drop-offs: where people gave up#
Drop-offs is the one that changes forms. It starts with four tiles (Started answering, Completions, Completion rate, and Completion duration), then a band showing how many of your Form views turned into Started answering. That first gap is people who opened the form and never typed a character; it's usually about the form's length or its opening question.
Below that, Question-by-question lists every question in order with a bar showing how many people Reached it and how many Answered it, and a chip on the right reading either No drop-offs or a percentage with a count.
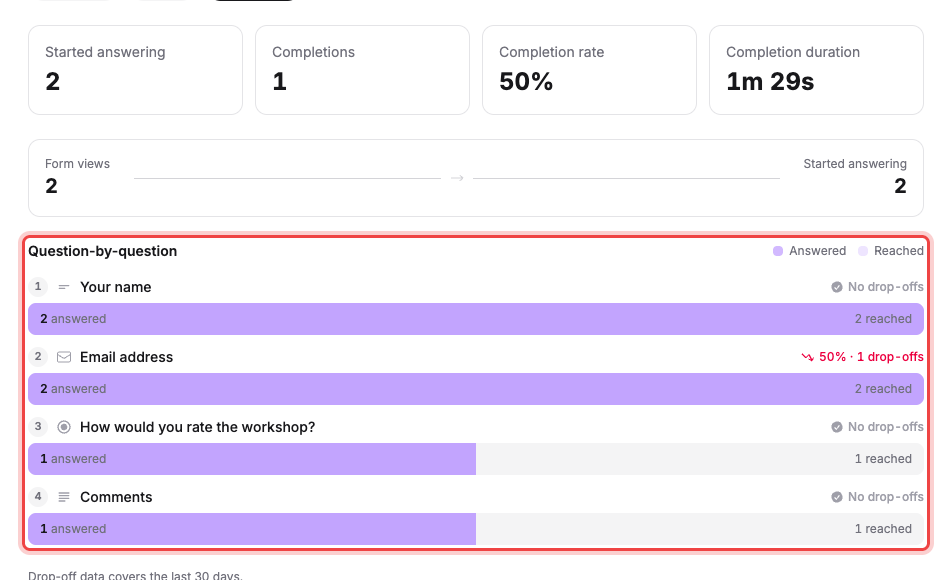
Read it top to bottom and stop at the first big drop chip. That question is where people quit, and you have three usual fixes: make it optional, move it later so people have already invested effort, or hide it behind a rule so only the people it applies to ever see it.
Choosing a date range#
The dropdown offers Today, Yesterday, Last 24 hours, Last 7 days, Last 30 days, Last 3 months, Last 6 months, Last 12 months, and All time.
On the Free plan anything longer than Last 7 days is marked · Pro and can't be selected: the page reads Ranges over 7 days require Upgrade. Whatever you pick stays in the page address, so you can bookmark or share a particular view.
If the Drop-offs tab is blurred behind a Pro badge#
Drop-off tracking is built on partial submissions, which are a Pro feature. On the Free plan the four tiles are greyed out and you get Ready to optimize your form? with an Upgrade plan button.
If Drop-offs says tracking is off for this form#
On a Pro plan the sub-tab also needs Capture partial submissions switched on for that particular form. When it isn't, the page says so and gives you an Enable partial submissions button: select it, then give the form time to collect a few new responses. Drop-offs are calculated from partials, so the report only covers the last 30 days and only responses since you turned it on.
If the numbers don't match your inbox#
Insights is scoped to the date range you picked, while the Inbox shows everything you've ever received, so the Submissions tile is almost always the smaller number. Widen the range to All time before comparing.
Every number on this page counts the same responses your Inbox does, and nothing else. A submission the filter caught sits in Spam, and one whose payment never landed sits in Incomplete; neither appears in a tile, an answer breakdown, or the drop-off funnel. A response that never completed is counted as a drop-off, because that is what it was.
One more thing surprises people: Visits counts people rather than page loads, so your own repeated previews collapse into one visit.